First of all, I would like to say that I am no expert and am not a baseball professional, just an over-zealous Giants fan with a love of numbers and logic..
When the Giants signed Randy this offseason, the perception was that suddenly the Giants had been transformed from a rebuilding team to a team on the fringes of contention. Added to the existing starting pitching was a ageless Randy coming off "strong" second half of 2008. Now healthy and showing dominance in spring, hopes were high. after a few shaky starts, Randy flashed the pitcher we expected for a few games…..and then for the last 3 starts he has got the shit kicked out of him…….
So what's wrong with RJ? Is ANYTHING wrong with RJ????
Since the Mets clubbed him like a baby seal last week, I have been pouring over the data seeing if there was anything of interest.
Velocity? No issue there, his Fastball and Slider are about the same as they were last year, and I can find no correlation between performance and fluctuation with velocity….
Strikeouts…..still good with 9.3K/ 9 IP……
Homeruns are up and Walks are up…..by about 1 per game each……
Lets Compare some data to 2008
Contact rate is slightly down 2.8% ......showing that the stuff looks to be there
Strike rate is down 4.8%, and first pitch strike rate is down 9.5% showing RJ is a little wild
Swing % is down 4.7%, matching the drop in Strike rate showing batters aren't chasing those extra balls out of the zone…..
Strand rates are down 10% and BABIP are up about 20 points, which most eggheads would say is bad luck…….
So a little unlucky, little gopheritis, and a little wild…..
So lets dig into Pitchfx and see if there is anything to be discovered……(some detail on pitchfx is found at the very bottom of this post) Using Bill James Game Score as a measure of performance, I ran as many variables as I can understand, I looked for any correlation….and interesting enough a couple things popped out……The first thing I noticed with the measured release point for the Fastball and the Slider being quite a bit different. The release point for the Fastball averaged about 7 inches difference from the Curve. Good god, is he tipping his pitches!?!....Well maybe, but this difference seems to be relatively consistent from the beginning of 2008 (as far back as I have data) so he was potentially "tipping" last year too. I compared this release point difference to game score and found no correlation, so this didn't seem to be the issue.
After looking at the correlation coefficient for a number of variables, two variables showed a decent correlation was the Horizontal component of release point for the Fastball AND the Slider. I threw out the 1st start of 2008, which seemed to be an outlier for both parameters, and found correlation coefficients of -0.37 for Fastball Vertical Release Point and -0.38 for Slider Vertical Release Point…..certainly not a strong correlation, but considering the inherent randomness of game score as a performance measure, it is worth more investigation.
What could cause the correlation…..I was thinking a higher arm angle could change the movement on pitch…a lefthanded side arm fastball would drop and drift back towards a leftie hitter, where a higher arm angle should result in less drop and less drift……a lefthanded sidearm slider would drop and drift away from a leftie, whereas a higher arm angle would result in more drop and left drift…….
So I looked at the movement values, and although there were possible trends, there was nothing solid to report in regards to correlation with game score or even release point…..
So what could be the issue…..is the Release Point data mean ANYTHING????
Let me slice the data another way……
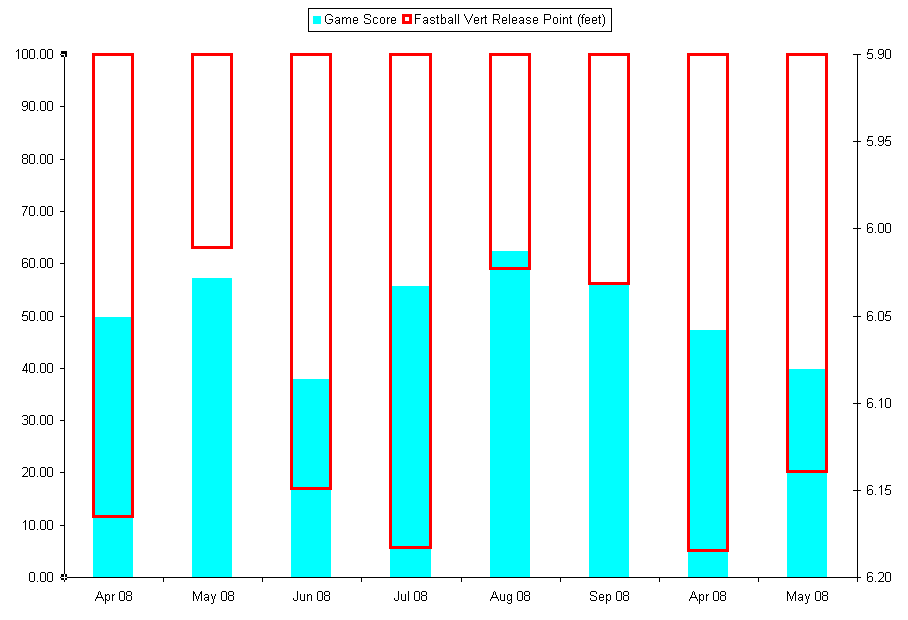
Fastball Vertical Release Point 6.10 feet and below Game Score Ave = 59.3
Fastball Vertical Release Point 6.13 feet and above Game Score Ave = 41.1
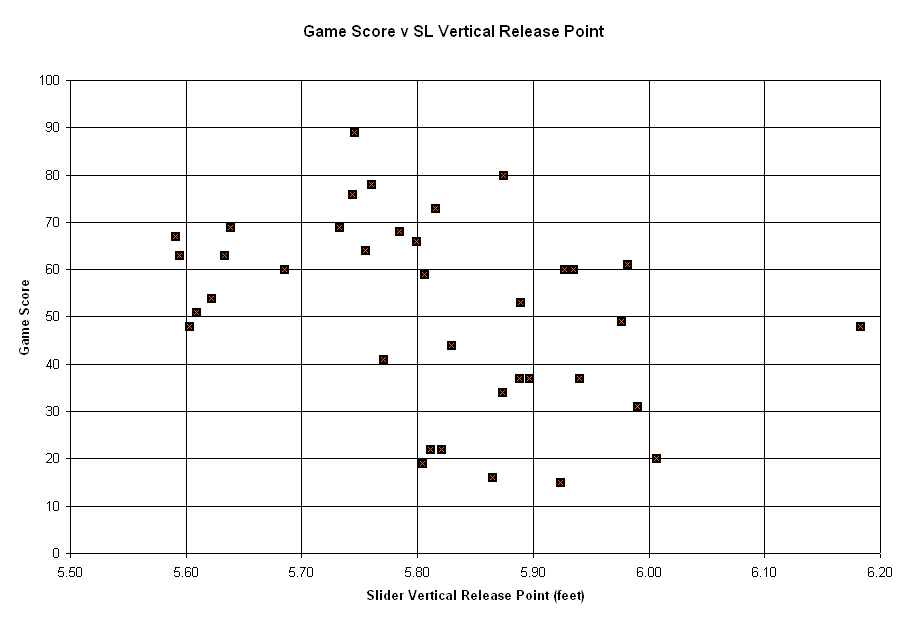
Slider Vertical Release Point 5.80 feet and below Game Score Ave = 61.5
Slider Vertical Release Point 5.81 feet and above Game Score Ave = 42.9
(Graphs of this data is included at the very end)
And in both cases, I sliced the data to give a very bad game on the borderline to the good side to try to even out any bias, and the averages are still quite a bit different…….
I think I AM onto something….but what…….
Lets go to the film
First lets look at the Mets game
In these two GIFs you see Fastball and Slider…..notice not just the arm angle, but the shoulder and the tilt of the head……
Fastball = higher arm angle, shoulders tilted, and head tilted…..
Slider = flat arm angle, shoulders level, and head level…..
pretty obvious slowed down 10x…….
OK, so lets look at 2008……again the Fastball and Slider……but look here…..a lower release point for both pitches seems to disguise the release point difference…….
2008 Fastball shoulders appear level, head upright……2008 Slider shoulders appear level, head upright……compare that to 2009 and it really looks quite a bit different.…..
too be fair, I had limited video to look at, and I chose games at Chase Field to try to get consistency with camera angles. These clips were selected because a fastball and slider was thrown to the same batter, but otherwise these were random clips.
I would like to make clear that I am only speculating...I intend on looking at this further and getting more data as it becomes available. I don’t know if he is tipping and if major league batters have noticed or could even make use of this information, I will leave it to you to interpret.
2008 09/18 FB VRP 5.97 SL VRP 5.69
2009 04/25 FB VRP 6.08 SL VRP 5.77
Here is one more vid of 2008
2008 8/22 FB VRP 6.01 SL VRP 5.73
The 13 K game highlights you can see here

And here are the charts
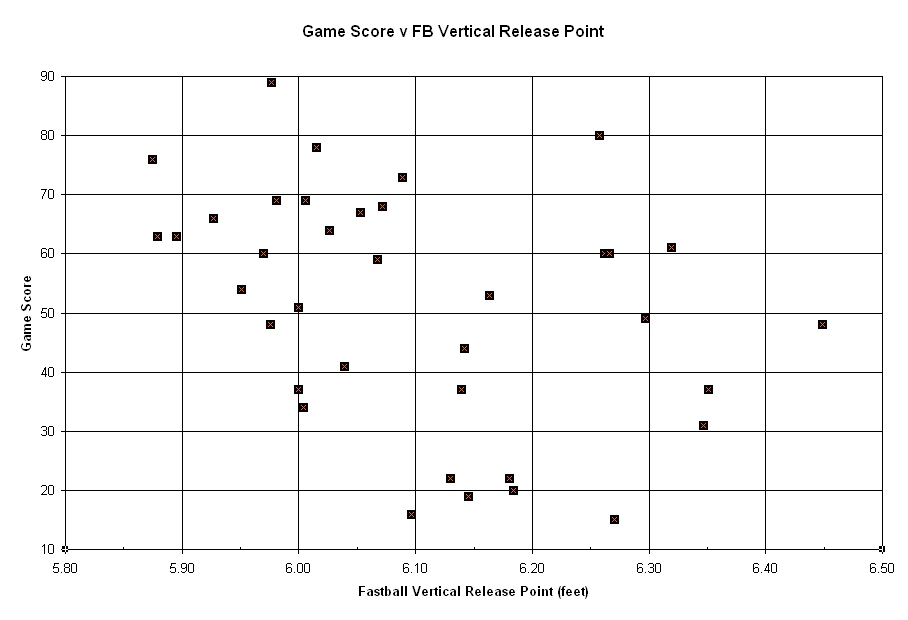
This last chart I did monthly averages…..Game score is the blue line, and FB Vertical release point is the red box……you can best visualize the correlation here….
Some notes on Pitchfx
1) Release point is measured in feet and calculated from ball location in relationship to ground 50 feet from the front of the plate.
2) Pitch recognition is based upon movement of pitch, and is inherently prone to error, especially when discerning the type of breaking pitch.
3) I believe that quite a few Sliders from 2008 were misclassified as other types of pitches. For sake of objectivity, I have just used the classifications as given to me from Pitchfx.
4) For purposes of this project I considered Pitchfx types of Fastball, Four Seam Fastball, and Two Seam Fastball to all fall within the same category.
5) Pitch movement is measured relative to a ball on the same trajectory moving straight under the influence of gravity
No comments:
Post a Comment