Well in order to make comparison easier, I normalized Runs Against and Runs for to the 2009 run environment of 4.44 runs per game. Then I looked at the difference compared to league average and also the spread, which in the difference between Runs scored and Runs allowed. For sake of simplifying language, I will refer to Runs Scored as Hitting and Runs Allowed as Pitching, the most important component of each by far, but of course not all encompassing descriptions.
Pitching wins championships, well see how this holds up looking at NL Pennant Winners and how do the 2009 Giants stack up?
The 2009 Giants have scored 0.26 runs per game below average, and allowed 0.76 fewer than average, giving a spread of 0.50.
The idea that pitching wins championships isn't exactly true, but there is a basis in fact according to the numbers. The average pennant winner had a spread of 0.80 runs over their opponent, but it was not balanced evenly between hitting and pitching. The average pennant winner scored 0.36 above average, and allowed 0.44 below average which showed a slight bias towards pitching. Additionally, of the 40 pennant winners only 1 had a worse than league average Runs Allowed, whereas 6 pennant winners had a lower than average hitting.
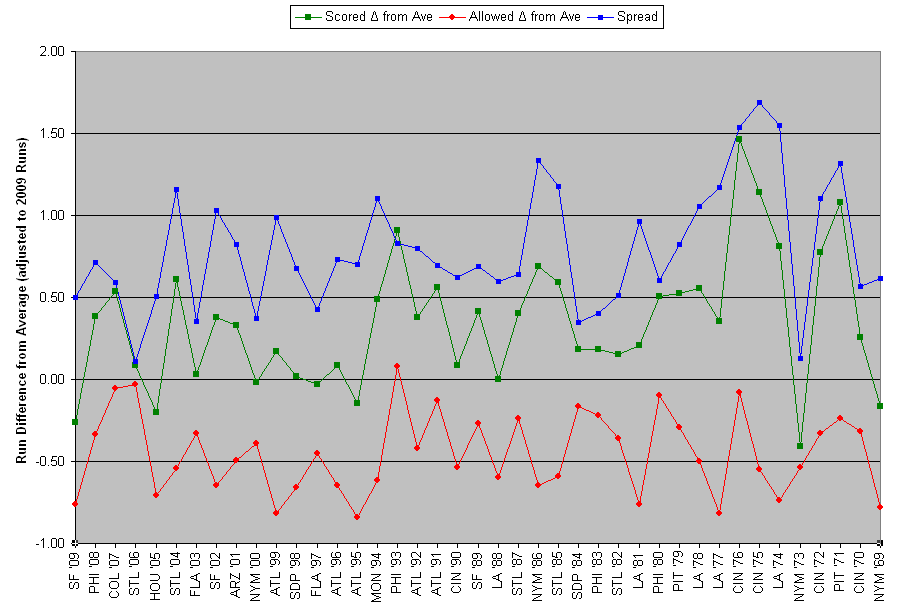
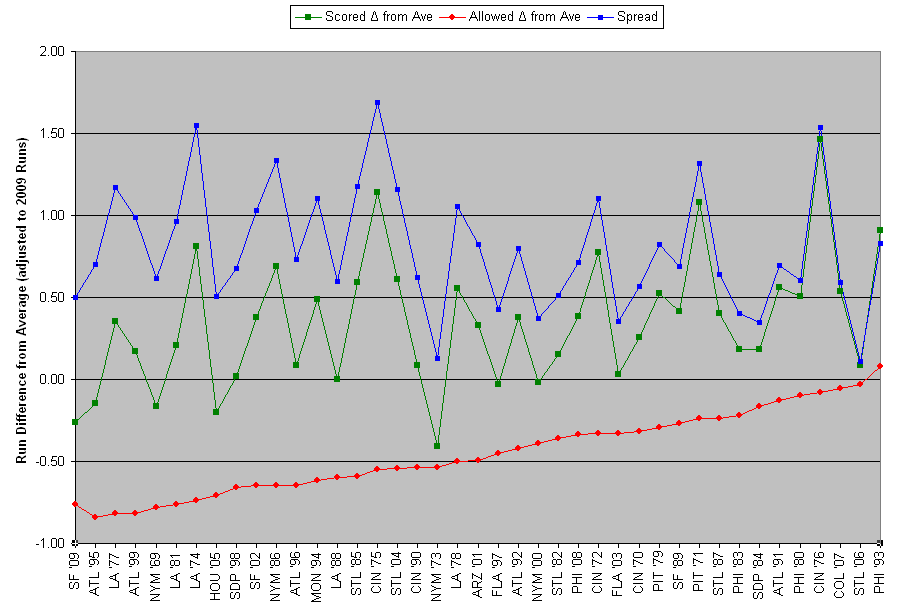
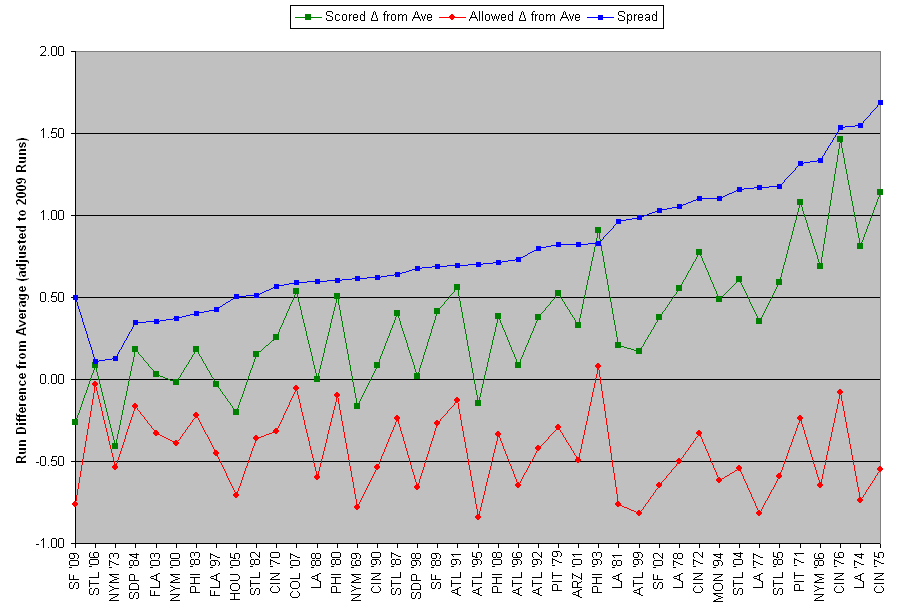
Now one question I had was correlation between run environments to the importance of pitching. I could not find a correlation between Run Environment and any other variable. But I did find something potentially interesting. When you look at the graphs below, notice the Green (scored) and Blue (spread) seem to track each other while the Red (allowed) jumps back and forth. The correlation between spread and runs scored is pretty strong (0.79 correlation coefficient), whereas the correlation between spread and runs allowed is fairly weak (-0.24).
What does this mean? Well, it doesn't say offense isn't important. But it does say that NL Pennant winners have more in common on the pitching end than on the hitting end. Teams that have large spreads have done so with great hitting and good pitching, and teams that have won with small spreads have done so with poor to good hitting and good pitching. In other words, pennant winning teams have run the gamut from poor hitting teams to great hitting teams, but almost invariably they all have pretty good pitching.
And interesting side note, the 2005 Astros match the 2009 closest in regards to runs scored, runs allowed, and run environment.
NL Pennant winners since 1696 worst offenses

NL Pennant winners since 1696 sorted by pitching
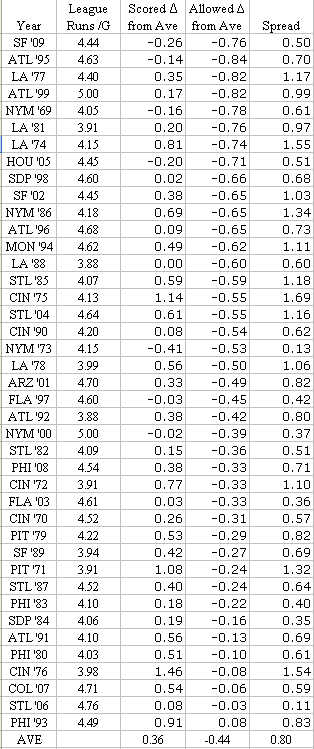
Runs Scored and Against compared to average
Sorted by Year
Sorted by Pitching
Sorted by Hitting
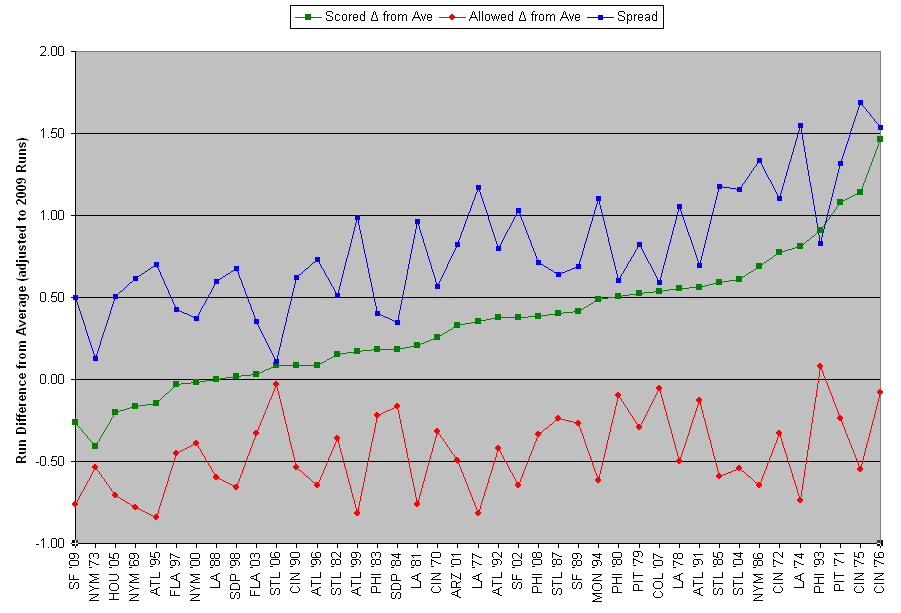
Sorted by Spread between Pitching and Hitting
No comments:
Post a Comment