So lets cut the data a few ways a take a look
from 2008 data
7 games Average Fastball less than 84 = Ave Game Score 36.5
21 games Average Fastball from 84-86 = Ave Game Score 43.7
4 games Average Fastball above 86 = Ave Game Score 70.0
Below you can see a graph of game score versus Fast Ball Velocity
Now lets look at the correlation between Velocity and Date
Now we have all heard about "Zito turned it around in the 2nd half" and all that shit, and honestly looking at the stats and him pitching I didn't buy it…..but maybe there really is something there……
Average Fastball Velocity by month (averaged by start, not by pitch)
84.2 MPH March/ April
83.8 MPH May
84.9 MPH June
85.3 MPH July
85.5 MPH August
86.0 MPH September
86.7 MPH April 2009
So Far this year
4/10 Ave 86.7 Max 88.4
4/16 Ave 87.1 Max 89.1
4/22 Ave 86.3 Max 89.3
Now it may not seem like much but it is just an average, and perhaps its enough to help keep hitters off the balance, or maybe its mental and the velocity gives Zito more confidence…..who knows…but I like the trend……
So maybe, just maybe…..this douchey son of a bitch might become a serviceable 4th starter….or maybe he pitches just well enough that the Mets will take us off our hands…..for 50% of his contract……
Click graph for version in new window
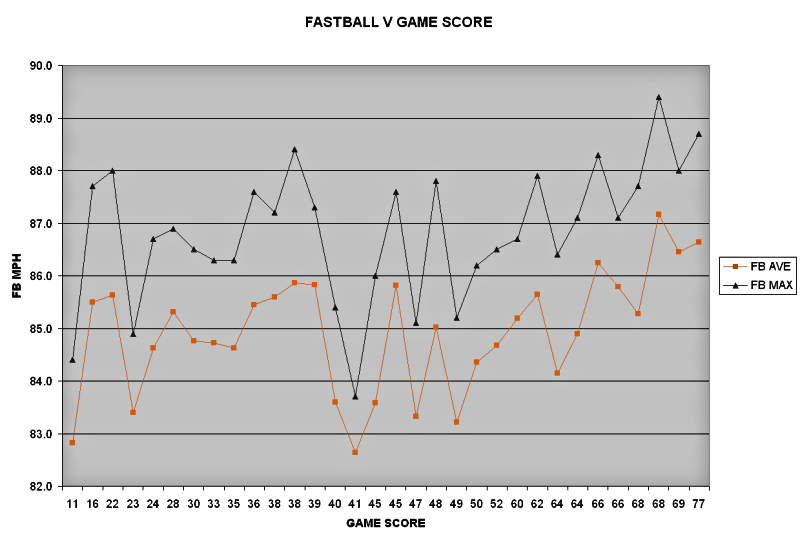
The graph above plots FB Velocity (y axis) versus Game SCore (x axis)
The Velocity is up and down for low game scores, meaning he was knocked around with slow and decent fastballs.
But notice on the high end of the game score, the fastball velocity better more consistently.
This means that his best games came with high velocity, whereas his worst games had high and low relative velocity.
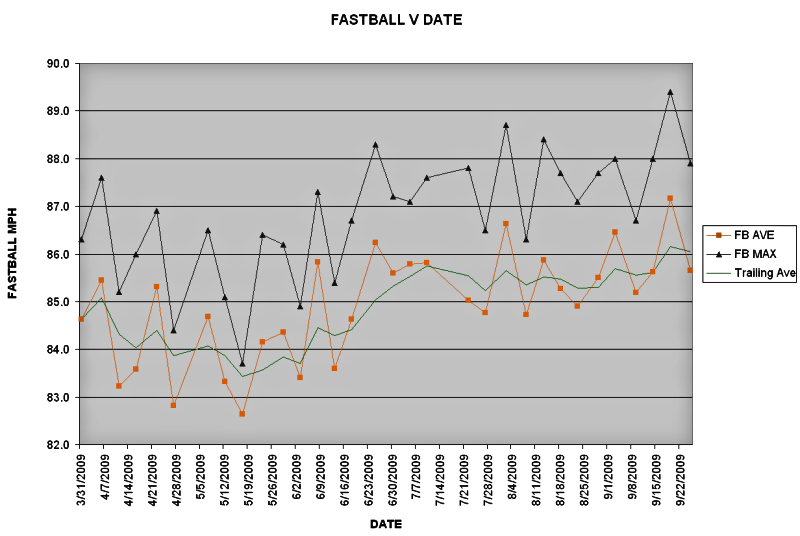
The graph above has velocity as the y axis and date of start as the x axis.
This graph jumps back and forth from start to start. But look at the dark green trendline as his fastball is higher and higher as the year passes....
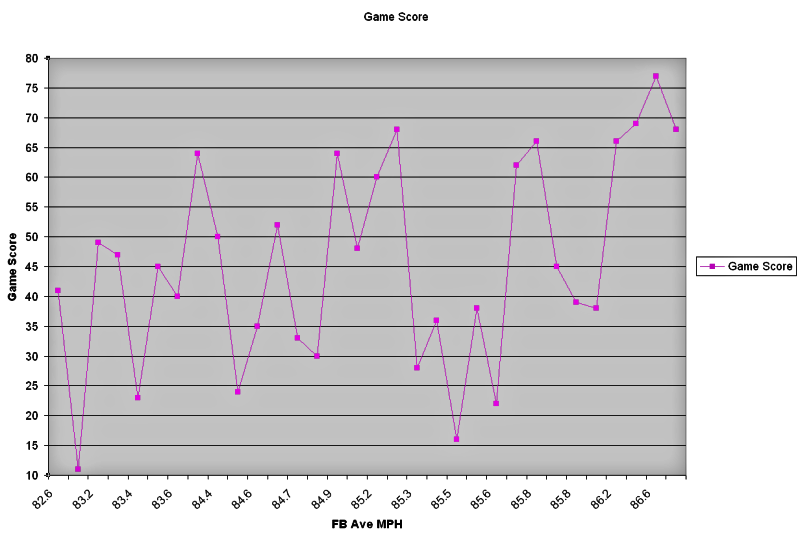
The last graph is a variation on the first graph, but turned on its side. Here Game Score is the Y Axis and MPH is the X axis. Look at the 65 game score line, he had 6 games above this line, and 4 of thos games are all the way on the right, which means these were his 4 best velocity days....
No comments:
Post a Comment